|
Home >
Resources >
TiCS Dashboards
TiCS dashboards
TiCS is a multi-project, multi-language and multi-site solution for automating quality and security analysis of source codes, based on the ISO/IEC 25010 (SQUARE) standard.
We propose you to browse the main dashboards.
The TiCS 'Dashboard' – 1: Projects are analyzed with a quality model, shared by more than 4,500 projects around the world and representing 1.1 billion lines of code analyzed every day. This model is public and is updated regularly.
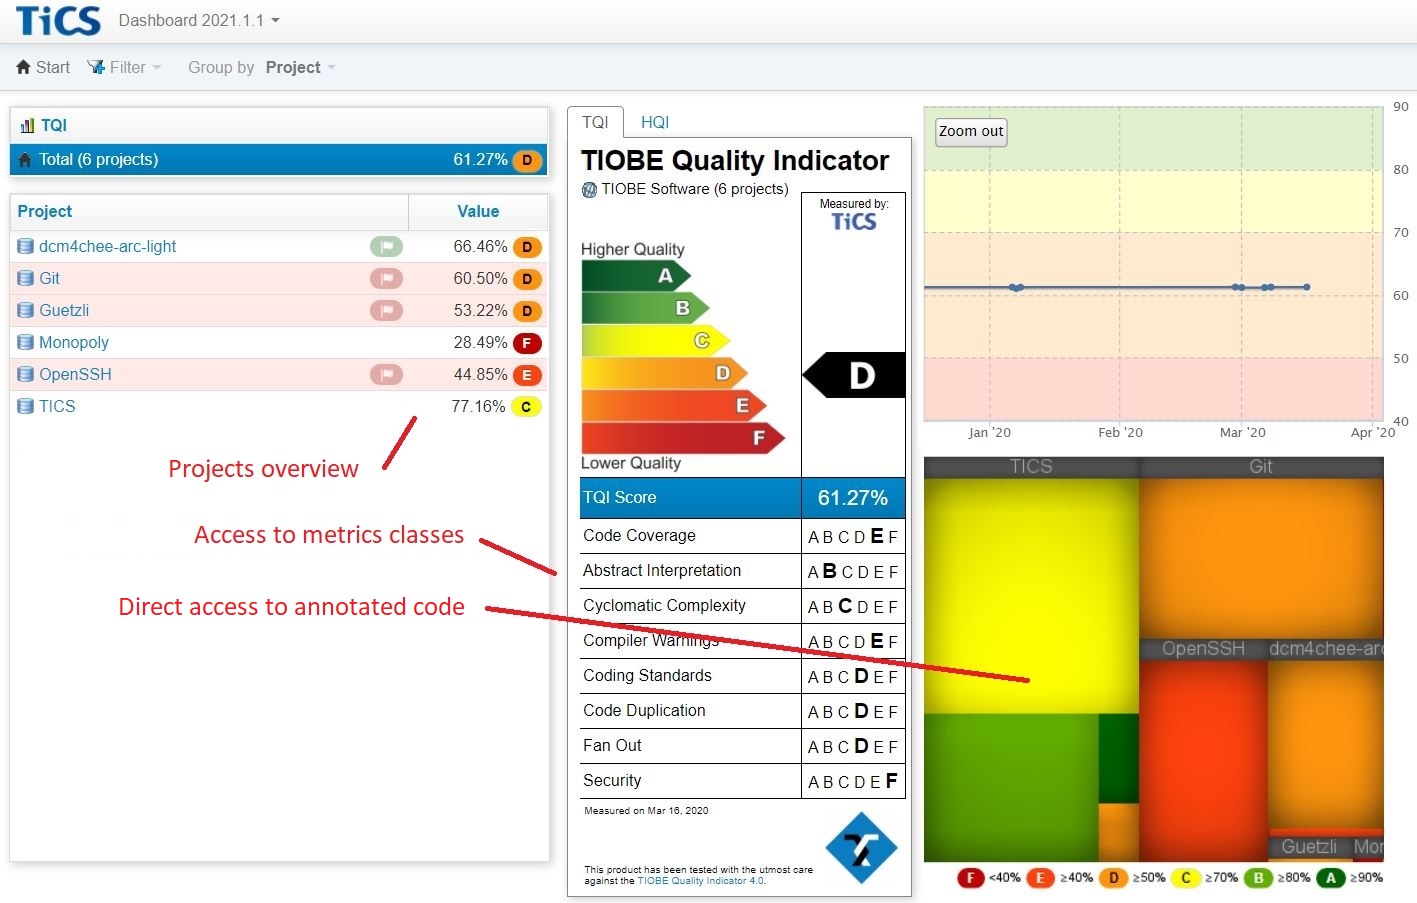
(Click on the image to enlarge it)
The TiCS 'Dashboard' – 2: the 'Dashboard' allows you to go very quickly from high-level metrics to the bugs details in the code.
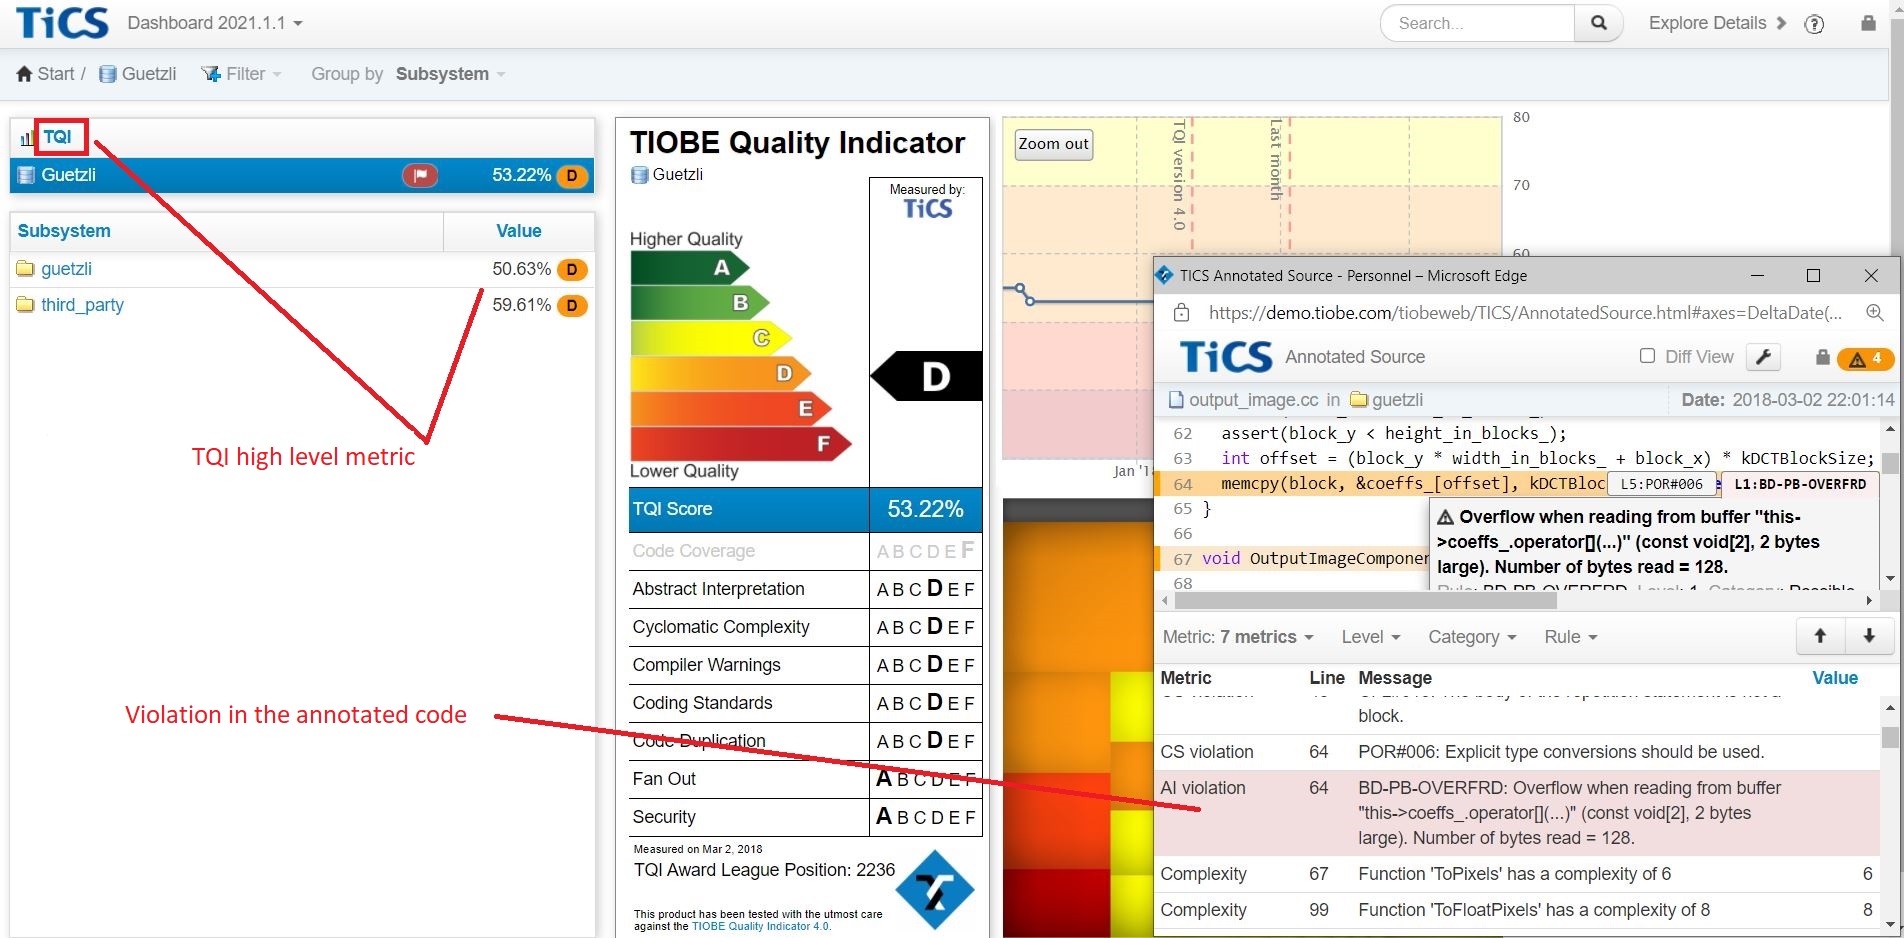
(Click on the image to enlarge it)
The TiCS 'Dashboard' – 3: Investigating the level 1 coding standard violations is very fast: just select the corresponding metric.
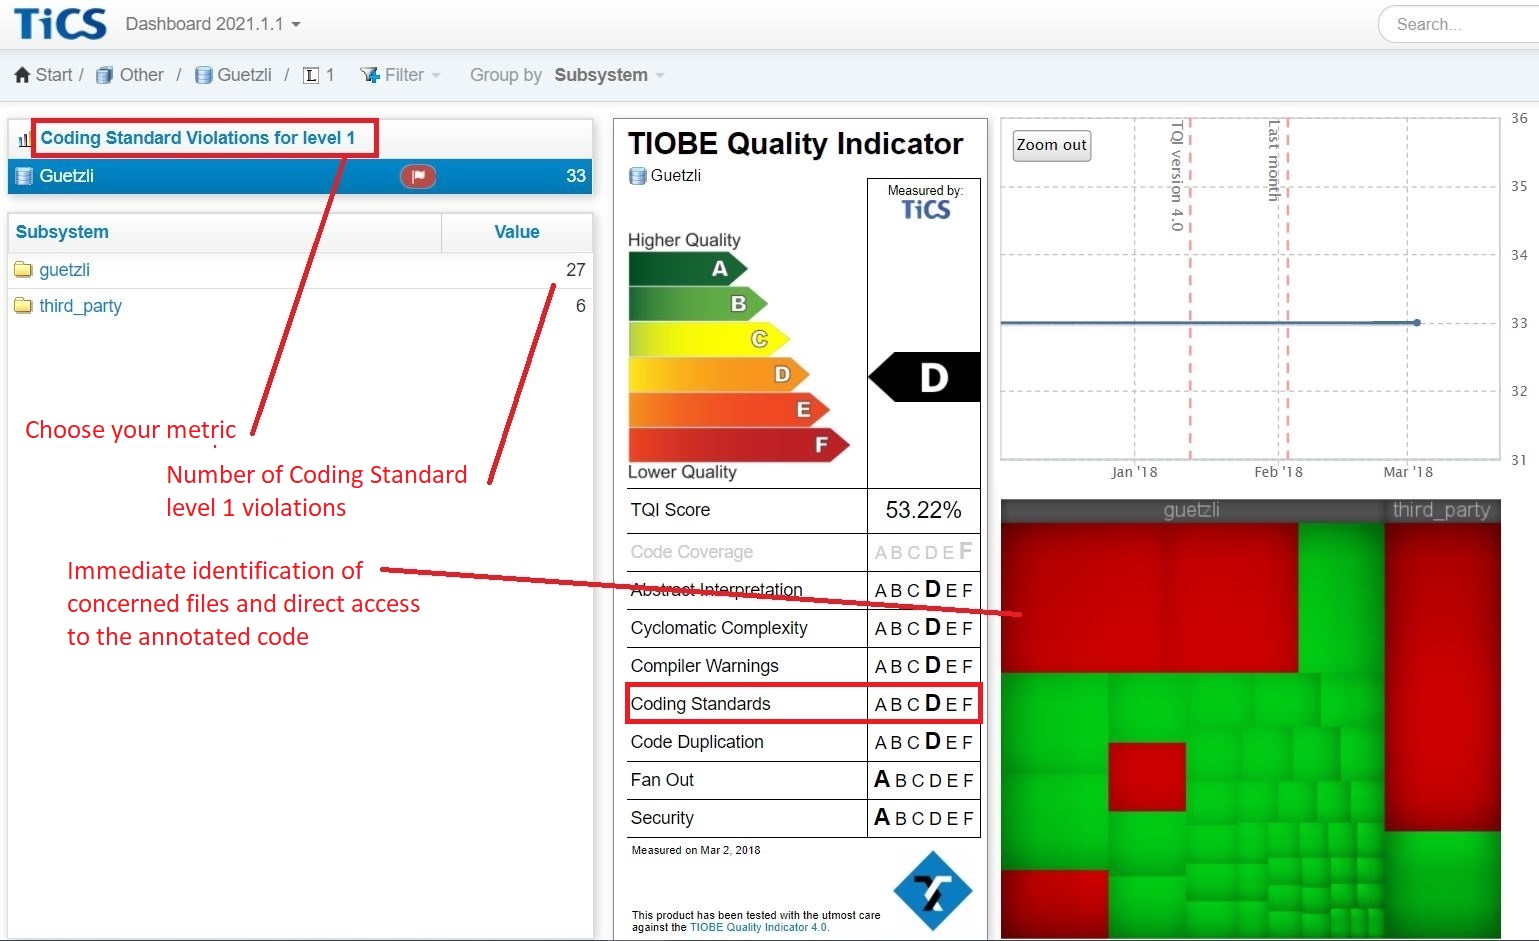
(Click on the image to enlarge it)
The TiCS 'Dashboard' – 4: It also provides the 'Root Cause Analysis' on projects. In general, an analysis of all metrics is available between two dates of your choice.
The 'Root Cause Analysis' gives the reason of changes occurring in the project: size modification (addition/removal of a library, new files,…), improvement/degradation of a KPI (modified files, fixed bugs, addition of new codes,…),…
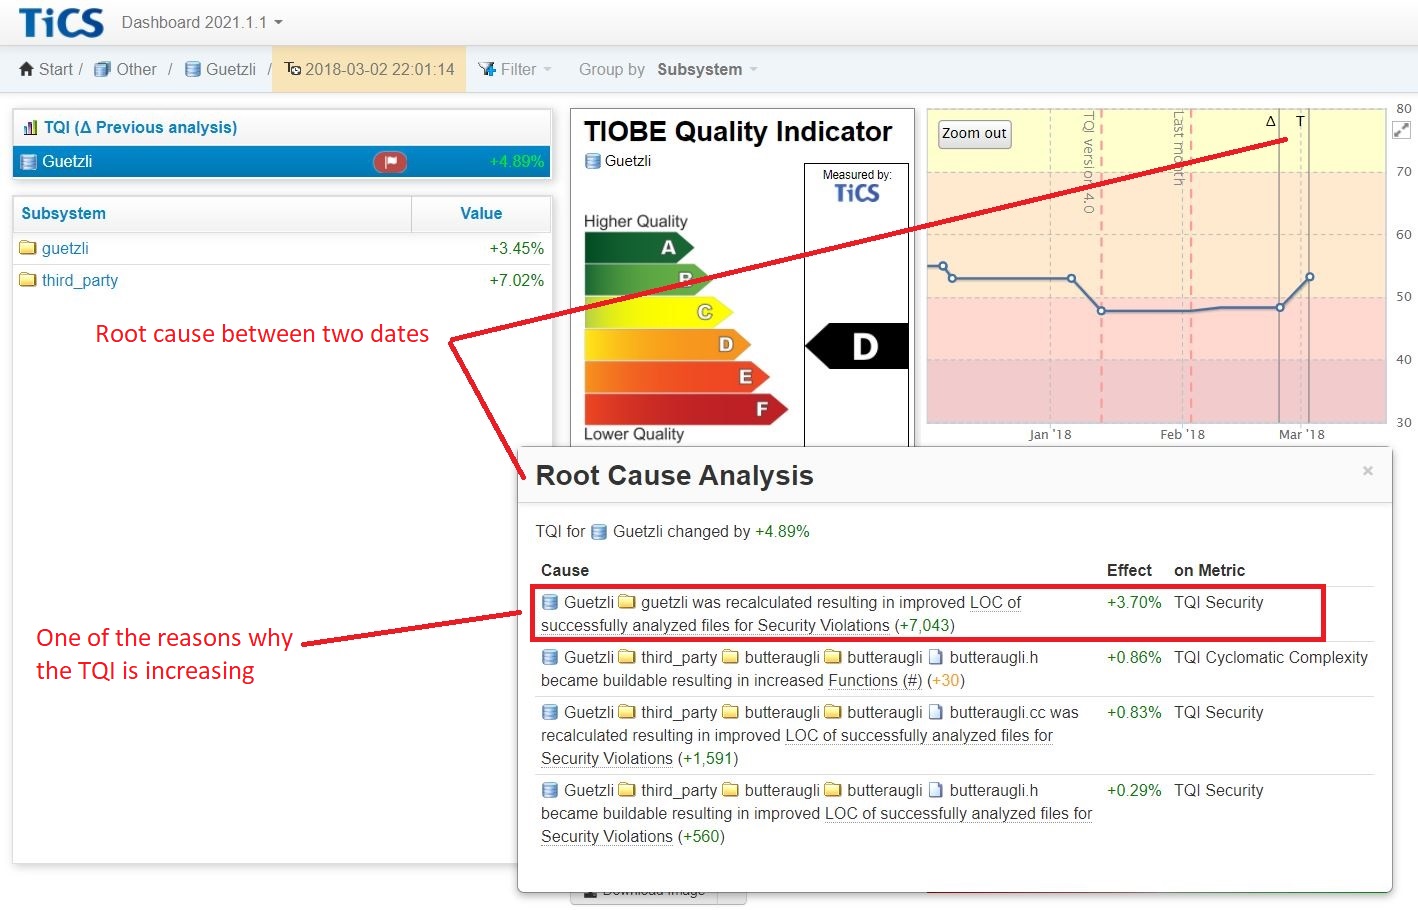
(Click on the image to enlarge it)
The TiCS 'annotated code': TiCS unifies the interfaces regardless of the analyzers used such as Pclint, C++Test, cppcheck, PMD, etc. (list of supported analyzers (extract)). Teams don't have to learn how to launch the tools or how to interpret the different reports. Whatever the tools, the interfaces are identical.
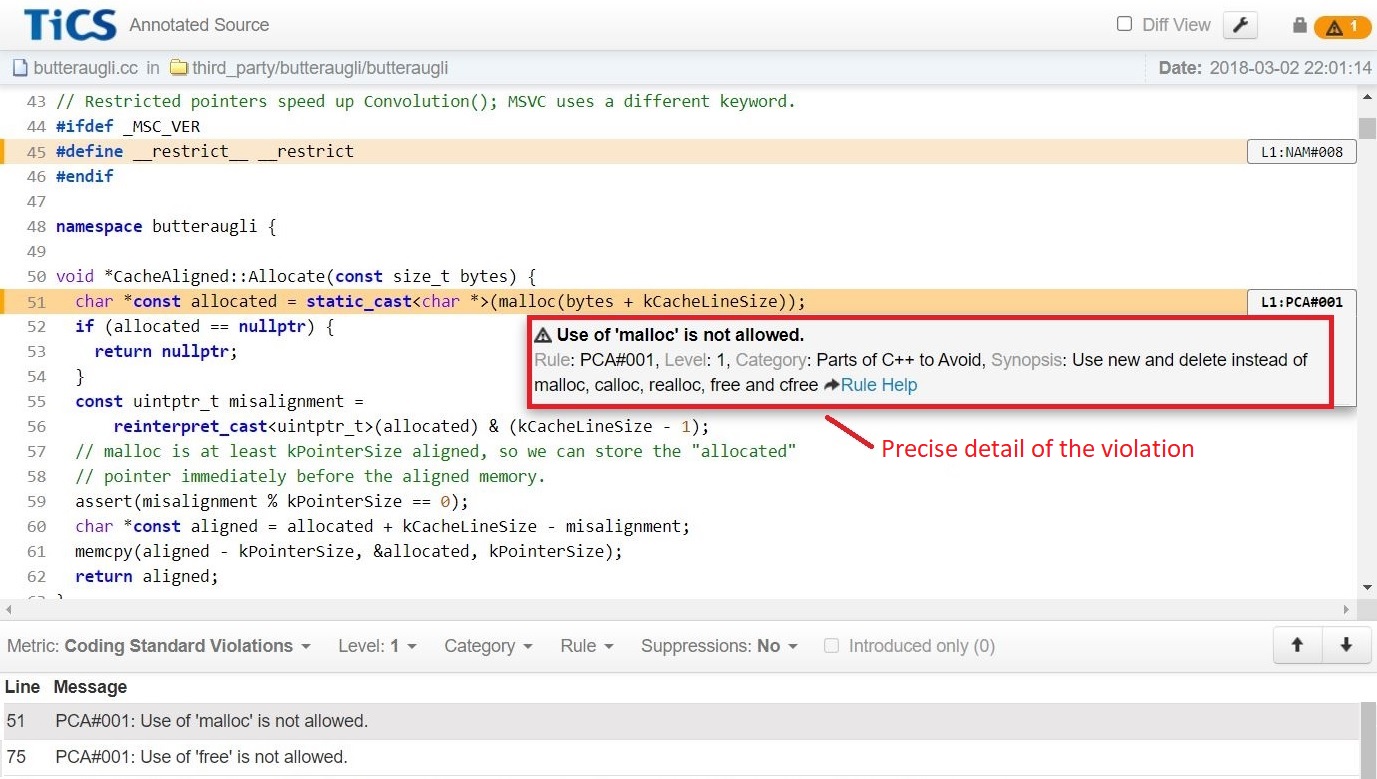
(Click on the image to enlarge it)
The TiCS 'to-do list': The 'to-do list' below gives the order of importance of the anomalies detected in the code. The model provides the impact of a fix on the quality of the code, which allows the most serious bugs to be fixed first.
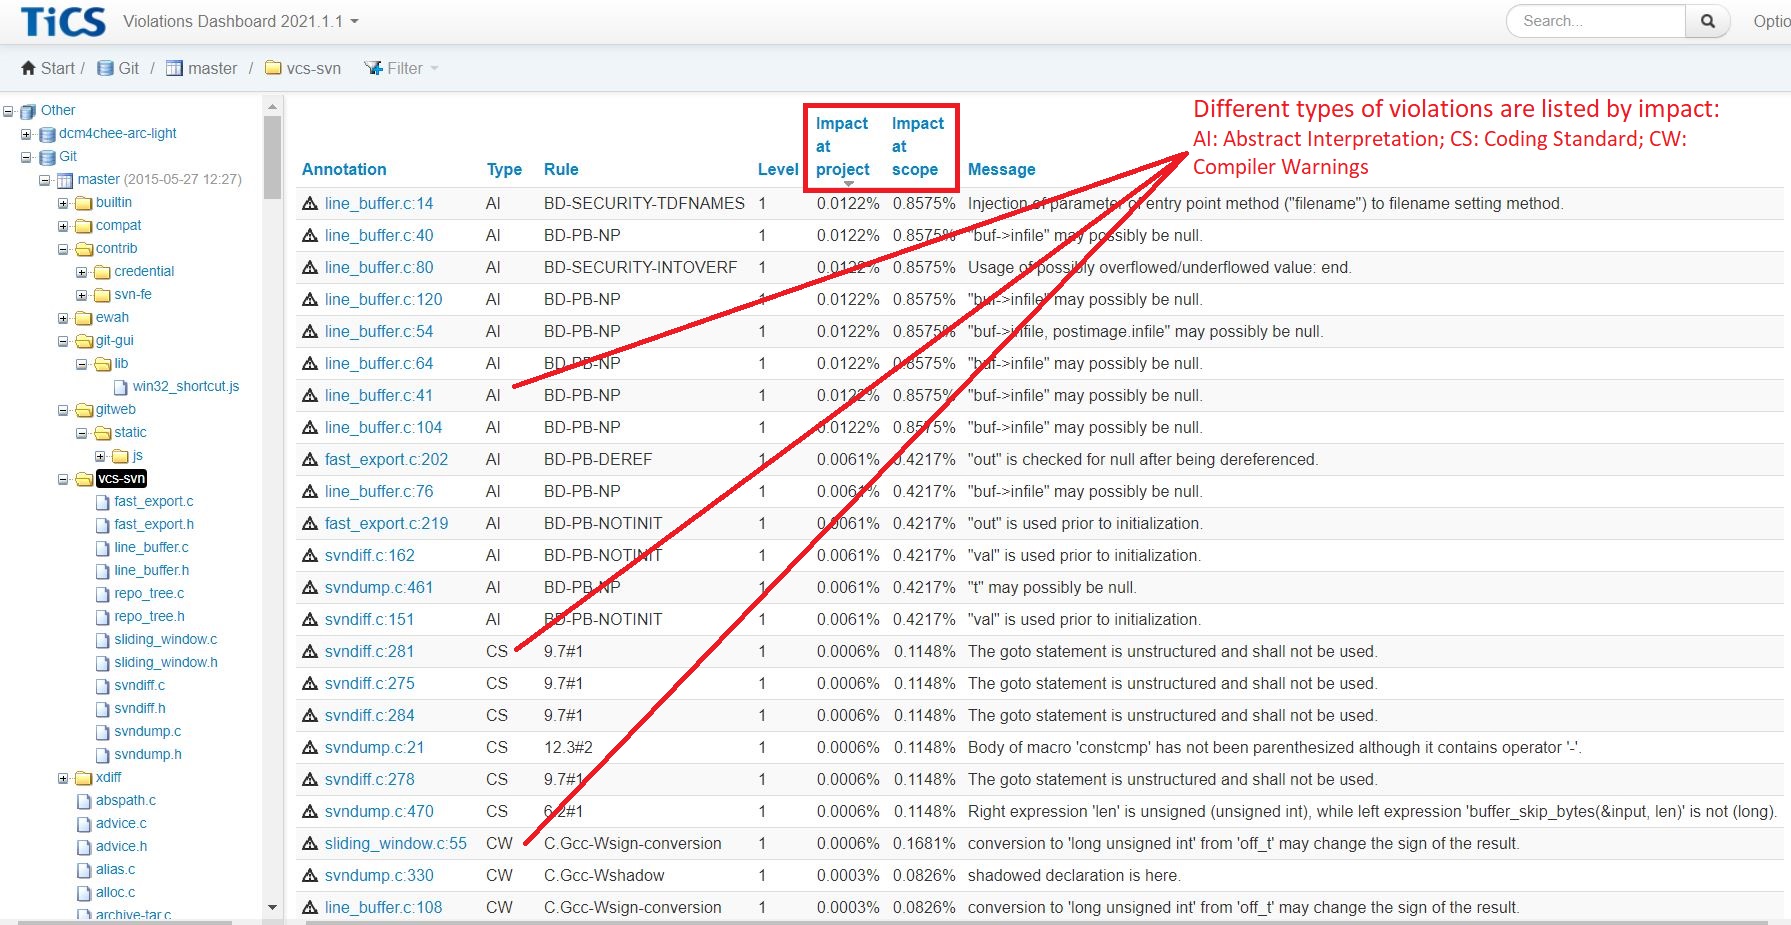
(Click on the image to enlarge it)
The TiCS 'client': Developers run their code analysis using the plug-in in their IDE or from the command line. Settings are retrieved from the server and are identical to those used for the project analysis.
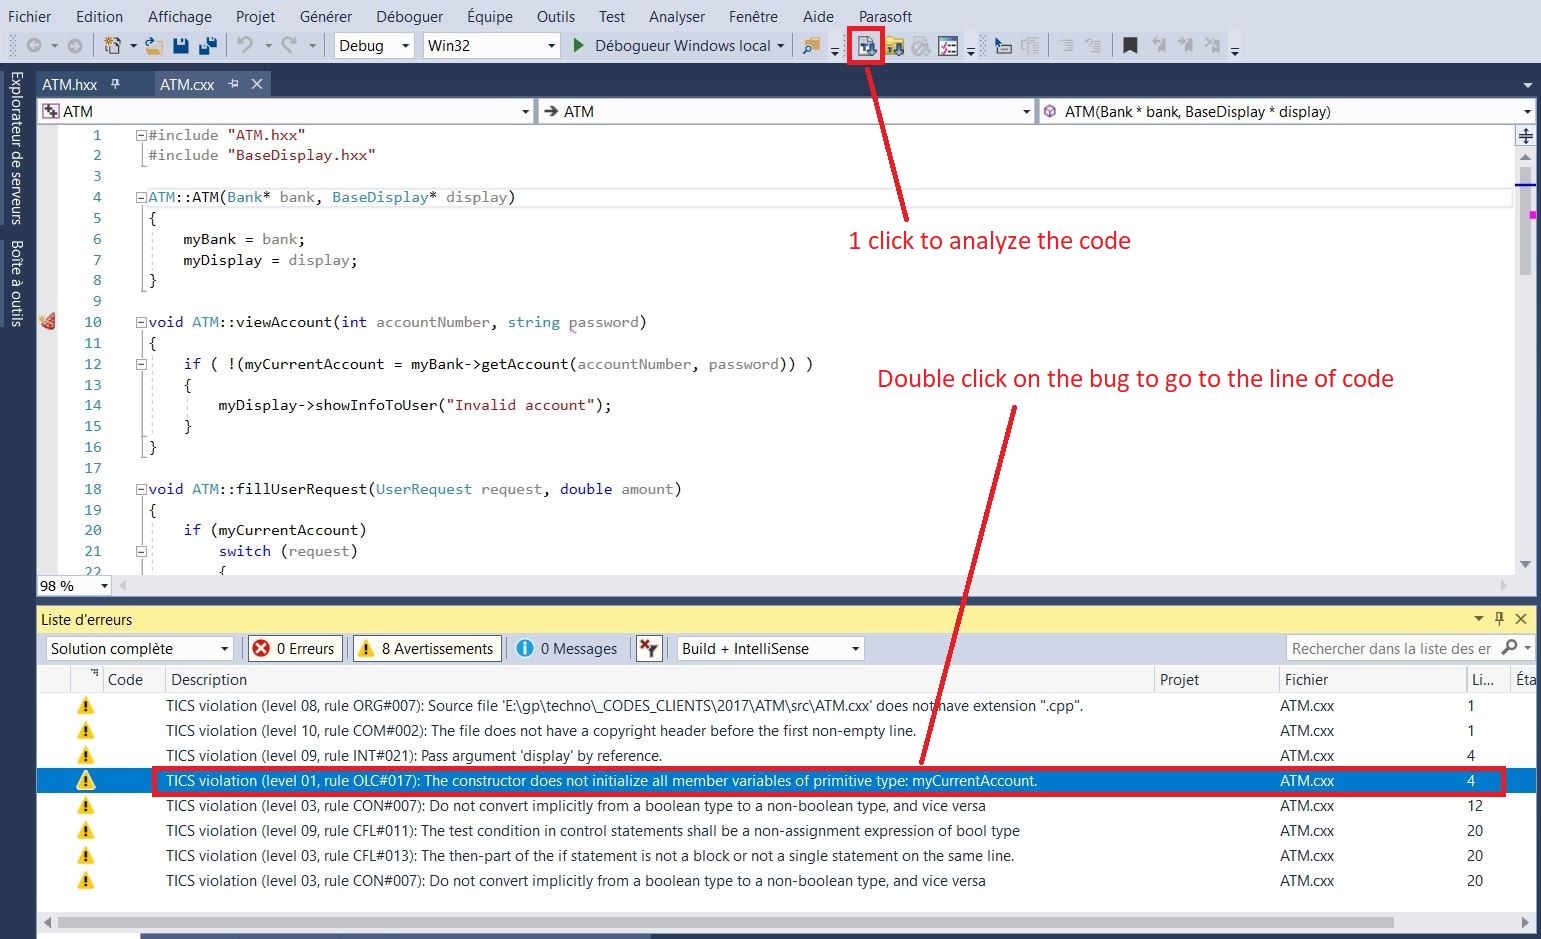
(Click on the image to enlarge it)
To go further with TiCS, we propose webinars of your choice.
|
|
Latest news

2024 November 11
Robin Radar Systems checks code quality
Robin Radar Systems, developer of bird and drone radar detection systems, starts using TIOBE's TiCS Framework to measure code quality.

2024 June 21
Schiphol checks code quality
Schiphol, Europe's 4th largest airport with over 60 million yearly passangers, starts using TIOBE's TiCS Framework to measure code quality.

2023 October 18
Fortune Technologies checks code quality
Fortune Technologies, a Taiwanese high-tech firm that provides enterprise IT solutions, has started to use TIOBE's TiCS Framework to measure code quality.
|

